Analysis | Is the S&P 500 bear market coming to an end?
After bottoming out in mid-October 2022, the S&P 500 index, which includes the 500 largest US companies, managed to recover some of the losses. Looking at the daily chart of the instrument, we can't help but notice an interesting technical situation - the “golden crossing” which took shape this week.
What is “Golden Crossing“?
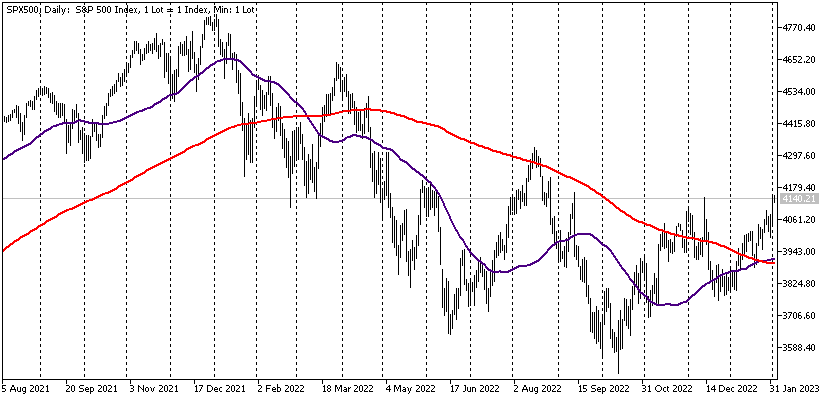
The golden cross is a widely used indicator among market participants to determine long-term trends in the price of an instrument. It is based on the intersection of the 50-day and 200-day moving averages. From the point of view of technical analysis, many market experts define the crossing of these two lines as the beginning of a new movement.
This week we saw the 50-day moving average cross above the 200-day. According to some analysts, this crossing is an early signal of a reversal of the trend and the beginning of a new upward movement.
What is the cause of the rise in the S&P 500?
From a fundamental analysis perspective, the main driver of the rally in the index was the inflation data. In recent months, we have seen a slowdown in consumer price growth in the US. And this, in turn, leads investors to believe that the Federal Reserve is already nearing the end of its monetary policy tightening cycle.
Yesterday (February 1), the two-day meeting of the Fed ended, which was also the first for this year. The central bank slowed down the pace of interest rate hikes, raising them by 0.25% (as expected by the markets).
During the press conference, Fed Chairman Jerome Powell said that several more hikes of 0.25% are on the way. What is new here is that central bankers will shift their focus more to economic data in order to assess how interest rate hikes affect economic activity and the level of employment. And this is a subtle hint that the rate-hiking cycle may indeed be coming to an end.
BenchMark Short-Term Customer Sentiments
When we talk about short-term movements, however, expectations for the S&P 500 are for a downward movement. Benchmark's market sentiment chart, which reflects short-term sentiment among clients, shows that 69% expect a near-term decline and 31% expect an increase.

The data is based on actually concluded transactions in BenchMark's MetaTrader platform as of 3:00 p.m. on February 2, 2023
You will find more indicators with market statistics developed specifically for BenchMark clients after logging in to the Portal for real clients.
The information presented is not and should not be perceived as a recommendation, advice to enter into transactions, investment research or consultation for making an investment decision, a recommendation to follow a particular investment strategy or be perceived as guarantee of future performance. The content is not tailored to the risk profile, financial capabilities, experience and knowledge of a specific investor. BenchMark uses public sources of information and is not responsible for the accuracy and completeness of the information, as well as for the period of its relevance after publication. Trading in financial instruments carries risk and can result in both profits and losses that are partial or in excess of the initial investment. For this reason, the client should not invest funds that he cannot afford to lose. This publication has not been prepared in accordance with regulatory requirements aimed at promoting the objectivity and independence of investment studies and investment recommendations, is not subject to a ban on concluding transactions in relation to certain financial instruments and/or issuers, prior to its distribution by the person who prepared it person or persons concerned for the investment intermediary and as such should be perceived as a marketing message. 60% of retail investor accounts lose money when trading CFDs with this provider. Consider whether you understand how SDRs work and whether you can afford to take the high risk of losing your money.