How terrible is the current optimism about US equities?
In March, just in the midst of the global pandemic, US equities became the subject of massive sales, falling to historic lows. This shock, however, was overcome quickly. Prices pushed from the bottom and went up more and more securely, driven mostly by equities of technology and biotechnology companies.
In recent weeks, market optimism has returned in full force, with the NAS100 equity index almost wiping out all the accumulated loss and is now close to the levels it was in March. The same has happened with the other two leading equity indexes US30 and SP500, which are benchmarks for the overall performance of the US equities.
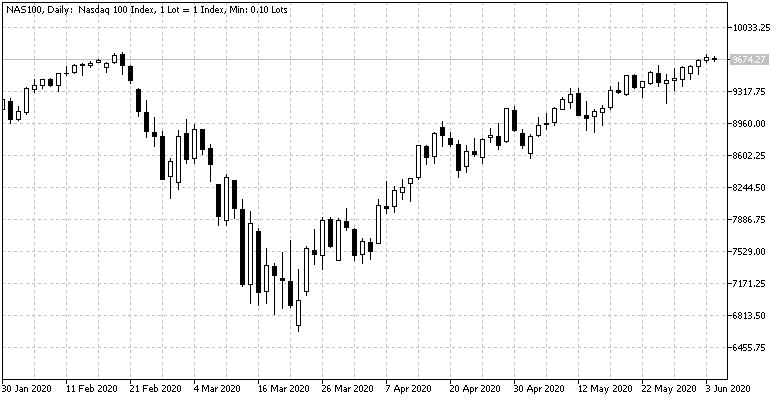
Source: BenchMark
However, analysts suggest that behind the recent appreciation it is very possible that there is a huge speculative factor.
Currently, there is a disproportion between the optimistic expectations about the market - expressed in high equity prices - and the real condition of the global economy slowed by the coronavirus.
This statement is supported by the fact that the recovery of European companies generally lags behind that of the American ones. The relative total return indices in USD between US and European equities have moved to 3.4 standard deviations indicating that US equities have drifted significantly away from its long-term relationship to European equities.
European equities reached their highest score compared to US equities at the end of 2007, but since then the roles have changed:
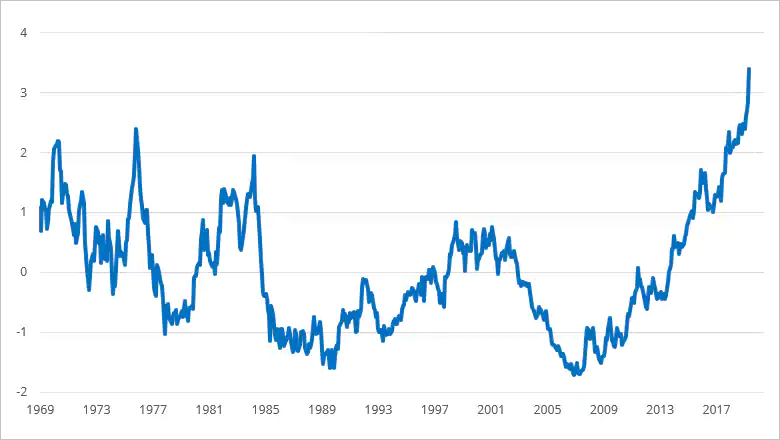
Source: Bloomberg, Saxo
In this regard, forecasts for US equities do not seem particularly optimistic and, according to analysts, there is a growing risk that investors who buy equities at current market levels will fail to form a positive return on investment within the next 10-year period until 2030.
Are there any grounds for purchases after all?
Current bond yields have been compressed everywhere, with the potential for US interest rates to turn even negative. Investors find themselves in a complex situation in which they desperately need assets they can trust in the long run.
In fact, there may be an alternative and it supports the equities of the so-called "high quality companies".
High-quality equities have managed to bring long-term returns over the last almost four decades. Long-term quality equities have performed better than the equity market as a whole since 1981, by a wide margin. In addition, Warren Buffett also recently changed his long-standing approach, replacing his preference for significantly undervalued equities with high-quality equities from companies that are easier to predict.
In their analysis, Saxo Bank strategists recommend long-term investors to set aside half of their portfolios for investments in equities of high-quality companies, and the rest to keep in cash, in short-term government bonds and a bit in gold. They compile a list of companies based on their preferred model, which includes the ratio between return on invested capital (ROIC) and weighted average cost of capital (WACC), where they are looking for companies with a ratio above one. In addition, they take into account the good financial risk indicators of the company in combination with the prospects for the industry in which the company operates:
Apple Inc.
- МТ5 code: #Apple
- Industry: Communications Equipment
- Mkt. Cap.: $1,395,006 mn.
- ROIC/WACC: 3.63%
- Net-debt-to-assets: -28.9%
- Total return year-to-date: 10.2%
eBay Inc.
- МТ5 code: #E.bay
- Industry: E-Commerce
- Mkt. Cap.: $31,761 mn.
- ROIC/WACC: 2.82%
- Net-debt-to-assets: 30.8%
- Total return year-to-date: 26.2%
Facebook Inc.
- МТ5 code: #Facebook
- Industry: Internet Media
- Mkt. Cap.: $660,736 mn.
- ROIC/WACC: 2.14%
- Net-debt-to-assets: -33.0%
- Total return year-to-date: 13.0%
Microsoft Corp.
- МТ5 code: #Microsoft
- Industry: Infrastructure Software
- Mkt. Cap.: $1,386,480 mn.
- ROIC/WACC: 2.62%
- Net-debt-to-assets: -16.5%
- Total return year-to-date: 16.6%
Monster Beverage Corp.
- МТ5 code: #MonsterBev
- Industry: Beverages
- Mkt. Cap.: $38,223 mn.
- ROIC/WACC: 3.20%
- Net-debt-to-assets: -25.3%
- Total return year-to-date: 14.2
Nike Inc.
- МТ5 code: #Nike
- Industry: Apparel, Footwear
- Mkt. Cap.: $154,788 mn.
- ROIC/WACC: 3.59%
- Net-debt-to-assets: -5.0%
- Total return year-to-date: -1.2%
Visa Inc.
- МТ5 code: #Visa
- Industry: Consumer Finance
- Mkt. Cap.: $377,719 mn.
- ROIC/WACC: 2.88%
- Net-debt-to-assets: 3.4%
- Total return year-to-date: 3.8%
Source: Bloomberg, Saxo
Sale or purchase of equities?
BenchMark offers for trading a wide variety of CFDs on equities under excellent trading conditions on the MetaTrader 5 platform. A Contract for Difference (CFD) is a regulated financial instrument that allows share price trading. In other words, when trading CFDs, market participants try to profit from the change in the equity price without actually holding a real equity.
CFDs allow you to buy and sell. Because only the asset price is traded, one can sell CFDs on Apple equities, for example, without owning those equities.
Excellent trading conditions
BenchMark offers a wide variety of CFDs under excellent trading conditions in the MetaTrader 5 platform:
| Min. trading volume | from 1 share (1 lot) |
| Margin requirement | from 10% |
| Commissions | $0.05/share |
| Min. commissions | No min. commissions |
| Automatic execution | YES |
| Hedging without margin | YES |
| Long/Short positions | YES |
| Stop/Limit orders restrictions | NO |
| Expert Advisors | YES, without restrictions |
| Real-time quotes | YES, completely free |
This publication is not prepared according to the rules for preparation of investment research. The information provided is not and should not be considered as a recommendation, advice, investment research or investment decision consultation, recommendation to follow a particular investment strategy or be taken as a guarantee for future performance. BenchMark uses public sources of information and is not responsible for the accuracy and completeness of the information, as well as for the period of its relevance after the publication of the analysis or strategy. Trading with financial instruments carries risk and can lead to both profits and losses.