3 easy and effective breakout strategies
One of the most popular and at the same time working technical strategies are those that involve breakouts of support and resistance. The success of breakouts can be increased when they are traded in the direction of the trend, adding indicators or trading in the context of the price structure in which they occurred.
These strategies can be divided into three major groups. One group includes the use of technical indicators, the second focuses on the use of structural levels in price movements, and The third includes both indicators and structural levels.
Breakout strategies
There are different types of trading strategies that involve breakouts. As with most technical strategies, those in the direction of the trend have the potential for higher success, so we will focus on them.
Most traders make a deal as soon as a breakout is registered. This significantly reduces the likelihood of the success of the trade, as the market often registers false breakouts. The three strategies outlined in the following lines show a more effective way to trade breakouts.
Successful test of the breakout level
Trading this strategy requires the price of the instrument to be in trend and to register a breakout of support or resistance. The trader goes in a trade after the price makes a successful test at the technical level.
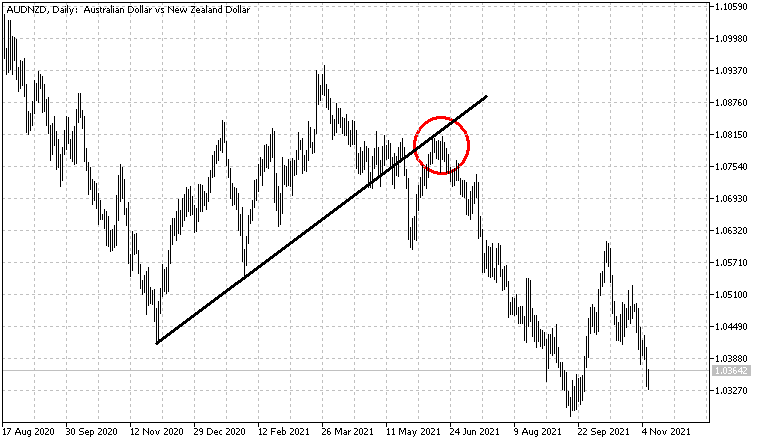
Chart 1
In Chart 1 we see that the currency pair is in a downward trend. The price registered a breakout of diagonal support, which was followed by a successful test of the technical level. The moment of entry is when we see that the test is successful, as an additional signal to suggest that the test will be successful is desirable, as it increases the likelihood of a successful trade. The stop is placed above or below the local maximum/minimum - depending on whether the trend is upward or downward.
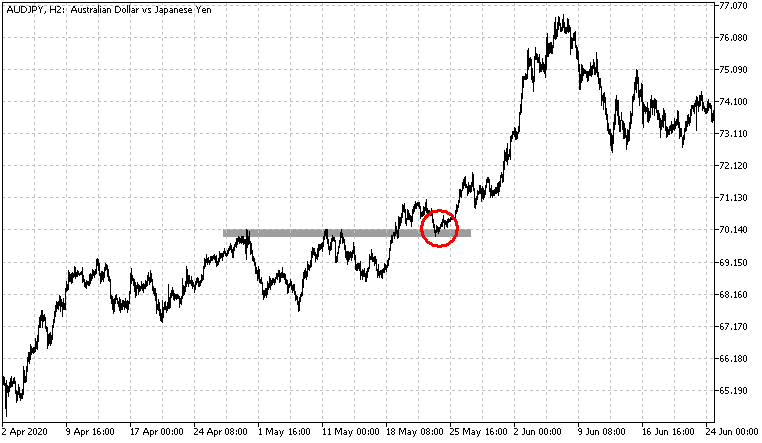
Chart 2
Chart 2 shows that this strategy can also be traded in the event of breakout at horizontal levels of support and resistance, and the logic is the same. We go in a trade after a successful test of the brеakout level, the breakout is in the direction of the trend, and the stop is placed below the local minimum in an upward trend and above the local maximum in a downward trend.
Consolidation of upward/downward movement
The next strategy is similar to the previous one, but with the difference that the trader has to wait for the price to confirm the downward/upward movement. Before a breakout is registered, the price must be in an upward or downward trend, and the breakout must be in the direction of the trend.
.png)
Chart 3
Once a breakout of support or resistance has been registered, we must see a test of the technical level, followed by a downward (upward) movement and breakout of the previous local minimum (maximum). The breakout of the previous local minimum (maximum) strengthens the downward (upward) movement and increases the probability of concluding a successful trade.
We can see in chart 3 that the price registers a breakout, which is followed by a test in point 1. When a breakout of the previous local minimum is registered in point 2 (green line), the trader enters a trade, and the stop is placed above the local maximum at point 1.
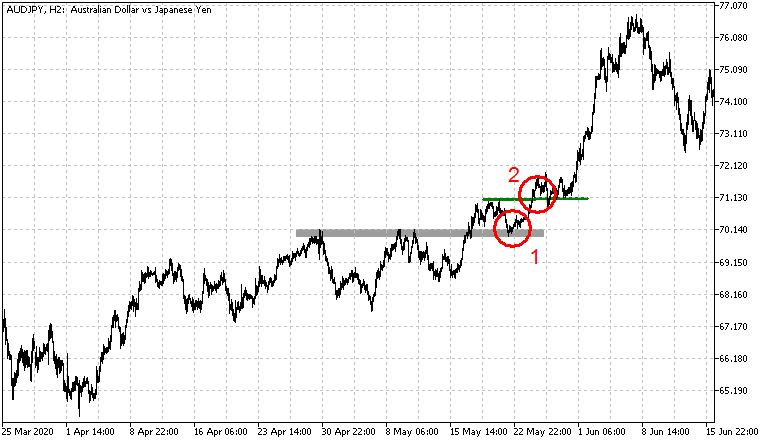
Chart 4
This strategy can also be traded for horizontal breakouts, and the logic is exactly the same. The situation can be seen in Chart 4, where the price registers a breakout, which is followed by a successful test in point 1. After the test, the price manages to register a breakout above the previous local maximum (green line) in point 2. This is the moment when the trader must go in a trade and the stop is placed below the local minimum at point 1.
A signal from the oscillator after the breakout
The strategy includes a breakout of support/resistance and a signal from the RSI oscillator. The price must again be in trend, and the breakout must be in the direction of the trend.
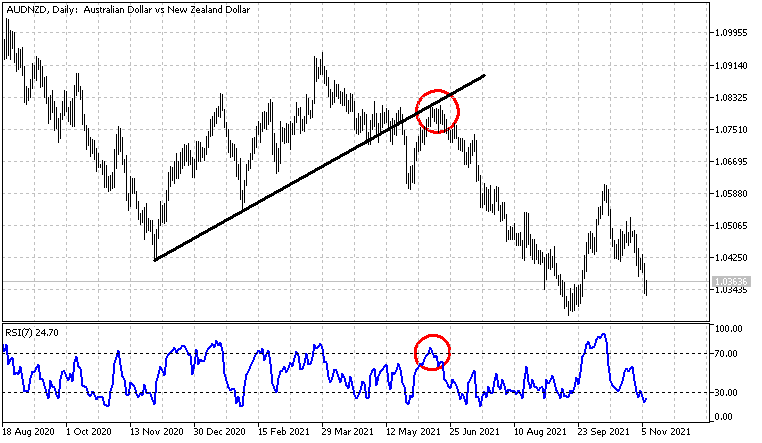
Chart 5
When a breakout is registered, we must wait for the price to return and test the level - this situation can be seen in chart 5. The oscillator should signal that the market is overbought/oversold while the price tests the breakout level. The signals from the oscillator must be in the direction of the trend, which means that in a downward trend the signals from the overbought zone are monitored, and in a downward trend the signals from the oversold zone are monitored. We enter a trade when the oscillator breaks the level 70 top-to-down or 30 bottom-to-up (for RSI) and the stop is placed above the previous local maximum/minimum.
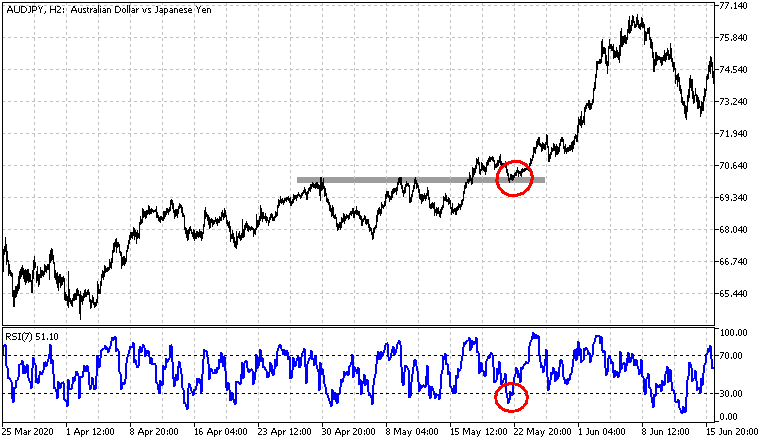
Chart 6
The breakouts of the horizontal levels of support and resistance in this strategy are traded in the same way, as an example can be seen in Chart 6. First, a breakout in the direction of the trend must be registered, followed by a test of the level. During the test, the oscillator must signal that the market is overbought or sold - depending on whether the trend is upward or downward.
Strategy choice
The choice of strategy depends on the views and understandings of the trader about the movements of the financial markets. There is no one-size-fits-all strategy for every trader, so a backtest of its success rate must be made. Breakout strategies are preferred by many traders because they are relatively easy to understand and implement, but they also have good effectiveness when additional criteria are added to increase their success rate.
Currency trading
BenchMark offers more than 70 currency pairs for online trading. Forex trading is offered as contracts for difference (CFDs) in the MetaTrader platform with a narrow spread, buy/sell, starting from 0.1 pips, without commissions, and free quotes in real-time
Currency pair trading makes it possible to achieve a result both when the price rises (through purchases) and when it depreciates (through short sales) and because currencies are traded on a margin, trades can be made without having to pay their full value.
| Commissions | No |
| Spread | from 0.1 pip |
| Min. trading volume | 1000 currency units (0.01 lot) |
| Margin requirement | from 0.25% |
| Automatic execution | Yes |
| Hedging without margin | Yes |
| Long/Short positions | Yes |
| Stop/Limit orders restrictions | No |
| Expert Advisors | Yes |
| Real-time quotes | Yes |
The information provided is not and should not be construed as a recommendation, trade advice, investment research or investment decision consultation, recommendation to follow a particular investment strategy, or be taken as a guarantee for future performance. The content is not consistent with the risk profile, financial capabilities, experience, and knowledge of a particular investor. BenchMark uses public sources of information and is not responsible for the accuracy and completeness of the information, as well as for the period of its relevance after publication. Trading in financial instruments carries risk and can lead to both profits and partial or exceeding losses from the initial investment. For this reason, the client should not invest funds that he cannot afford to lose. This publication has not been prepared in accordance with regulatory requirements aimed at promoting the objectivity and independence of investment research and investment recommendations, is not subject to a ban on transactions in regard to certain financial instruments and/or issuers before its distribution by the person or persons concerned for the investment firm and as such should be perceived as a marketing message.